Wazuh installation on Ubuntu 22.04 is a straightforward process when you follow a structured, step‑by‑step approach. In this guide, you’ll learn how to install Wazuh using the all‑in‑one installation method, configure the dashboard, and even change the default Wazuh admin password for secure access. This tutorial is fully tested on Ubuntu 22.04 and ideal for SOC analysts, sysadmins, and cybersecurity engineers.
Whether you’re building a home lab, setting up security monitoring for a small office, or preparing for a SOC role — this guide has you covered.
Table of Contents
- Step 1 — Set Up the Ubuntu VM in VMware Workstation
- Step 2 — Install Base Dependencies
- Step 3 — Install Wazuh All-in-One Stack
- Step 4 — Access the Wazuh Dashboard
- Step 5 — Change the Default Wazuh Admin Password
- Step 6 — Deploy a Wazuh Agent
- Step 7 — Enable File Integrity Monitoring (FIM)
- Step 8 — Monitor Linux Resources with Wazuh
Step 1 — Set Up the Wazuh Server VM in VMware Workstation
Before installing Wazuh, you need a properly configured virtual machine. I’m using VMware Workstation with Ubuntu Server 22.04 LTS. Here are the recommended hardware specifications:
| Resource | Recommended |
|---|---|
| Virtualization Platform | VMware Workstation (latest) |
| Operating System | Ubuntu 22.04 or 20.04 LTS |
| RAM | Minimum 8 GB (4 GB works for lab) |
| CPU | Minimum 4 Cores (2 cores for lab) |
| Disk Space | 100 GB recommended (80 GB for lab) |
| Network Adapter | Bridged (for LAN reachability) |
Here’s the exact VM configuration I used for my lab:
- VM Name: Wazuh-Manager
- OS: Ubuntu Server 22.04.3 LTS
- Disk: 80 GB (dynamic allocation)
- RAM: 4 GB
- CPU: 2 Cores
- Network: Bridged Adapter — so the Wazuh server is reachable from my MikroTik router and all other devices on the LAN
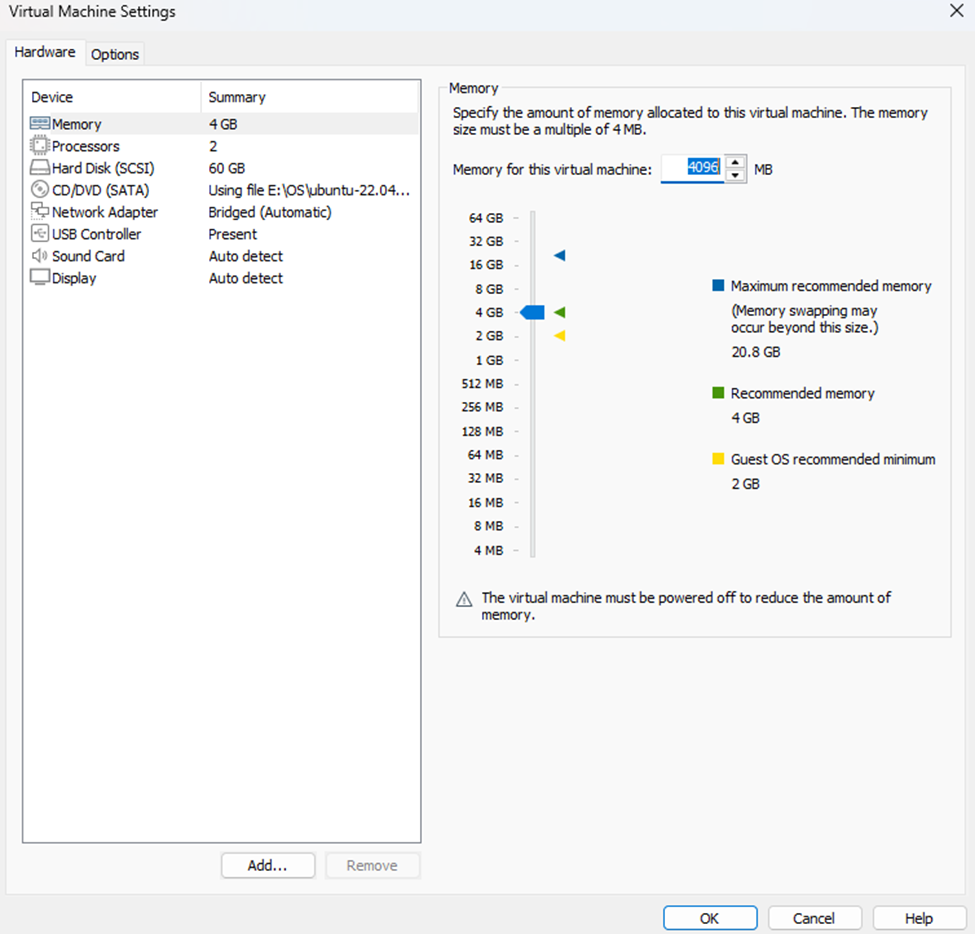
Image: VMware Workstation Ubuntu Server machine hardware information
Once your VM is up and Ubuntu Server is installed, log into the terminal and proceed to the next step.
Step 2 — Install Base Dependencies
Before running the Wazuh installer, update your system and install a few essential packages:
sudo apt update && sudo apt upgrade -ysudo apt install curl apt-transport-https unzip software-properties-common -yThis prepares the system with the tools the Wazuh installation script depends on — including curl for downloading the script and apt-transport-https for secure package sources.
Step 3 — Install the Wazuh All-in-One Stack
Wazuh provides an official all-in-one installer script that sets up everything automatically. This single script installs:
- ✅ Wazuh Manager
- ✅ Elasticsearch (OpenSearch)
- ✅ Filebeat
- ✅ Kibana
- ✅ Wazuh Dashboard
Run the following commands in sequence:
Download the installer script:
sudo curl -sO https://packages.wazuh.com/4.7/wazuh-install.shMake it executable:
sudo chmod +x wazuh-install.shRun the installer and log the output:
sudo ./wazuh-install.sh -a | tee wazuh-install-log.txtAfter the installation completes, retrieve your generated admin credentials from the log file:
grep 'admin' wazuh-install-log.txtgrep 'password' wazuh-install-log.txtThese commands will surface the auto-generated admin username and password you’ll need to log in to the dashboard. Save them securely — you’ll need them in the next step.
Step 4 — Access the Wazuh Dashboard
With the installation complete, open your browser on any machine in the same network and navigate to your Wazuh server’s IP address over HTTPS:
https://<your_vm_ip>
Example: https://10.10.100.10
Log in using the credentials you retrieved in the previous step:
| Field | Value |
|---|---|
| Username | admin |
| Password | [Retrieved from wazuh-install-log.txt] |
If everything went correctly, the Wazuh Dashboard will load successfully. You’re now looking at your own SIEM platform. 🎉
Step 5 — Change the Default Wazuh Admin Password
Wazuh ships with a dedicated password management script. This is the official, supported method — no hacking around config files.
Download the password tool:
sudo curl -so wazuh-passwords-tool.sh https://packages.wazuh.com/4.7/wazuh-passwords-tool.shMake it executable:
chmod +x wazuh-passwords-tool.shSet the new admin password:
sudo ./wazuh-passwords-tool.sh -u admin -p 'MyNewSecurePassword'Replace MyNewSecurePassword with a strong password of your choice. The script handles the rest — no service restarts needed manually.
Step 6 — Deploy a Wazuh Agent
A Wazuh Manager without agents is just an empty dashboard. Let’s deploy your first agent — the lightweight process that runs on the endpoints you want to monitor and ships logs/events back to the manager.
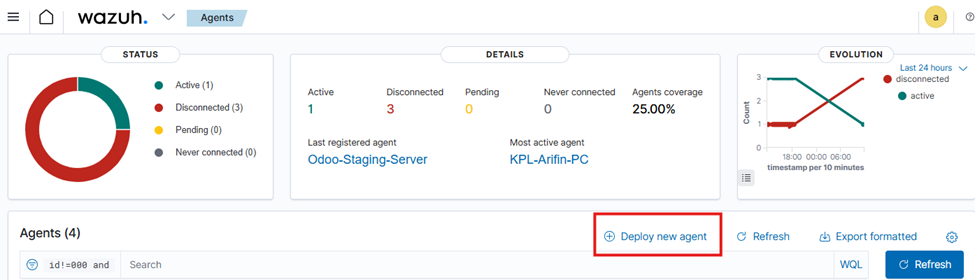
The easiest way to generate the agent install commands is directly from the dashboard:
1. Log into the Wazuh Dashboard
2. Click the dropdown menu in the top-right corner
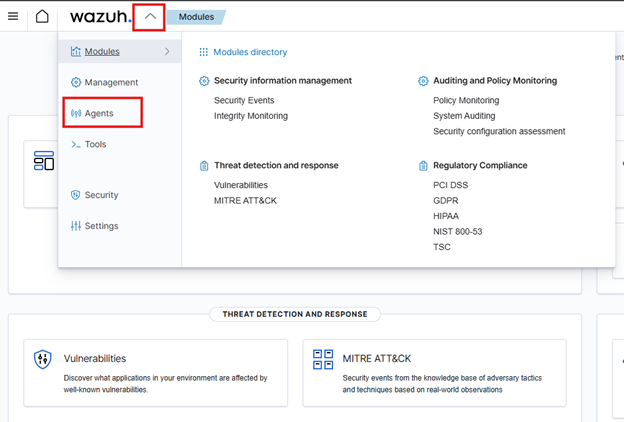
3. Navigate to Agents → Deploy New Agent
4. A deployment wizard will open — configure the following:
- OS: Select your target platform (Linux, Windows, macOS)
- Server Address: Enter your Wazuh Manager’s IP (e.g.,
10.10.100.10) - Agent Name: Enter a descriptive name (e.g.,
webserver-01,db-server)
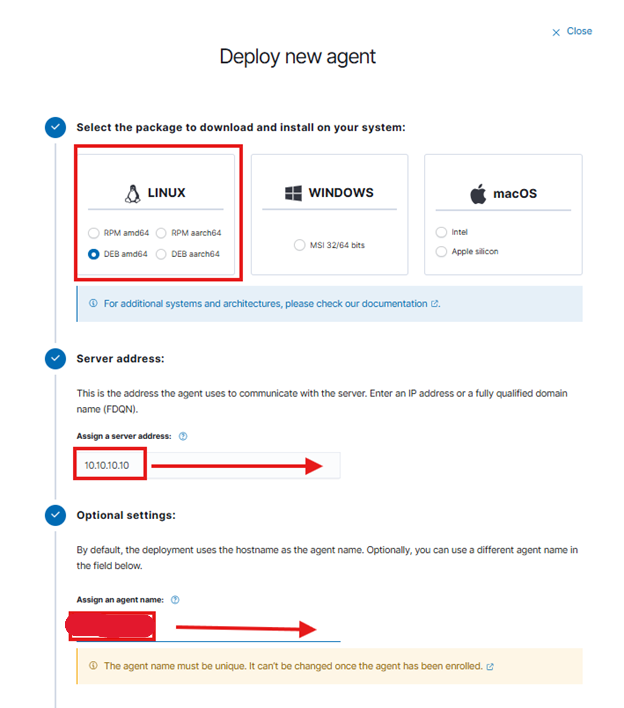
5. Copy the generated install commands and run them on the target endpoint
The wizard generates agent-specific install commands tailored to your OS and server configuration. Once the agent is installed and started, it will appear in the dashboard within minutes.
Step 7 — Enable File Integrity Monitoring (FIM)
File Integrity Monitoring is one of Wazuh’s most valuable features — it detects unauthorized changes to files and directories in real time. Here’s how to configure it on a Linux agent.
On the Wazuh Agent
Open the agent configuration file:
sudo nano /var/ossec/etc/ossec.confFind the <syscheck> section and make the following changes:
1. Reduce the scan frequency to 5 minutes (default is 12 hours):
<!-- Frequency that syscheck is executed — default every 12 hours -->
<frequency>300</frequency>
2. Add the directories you want to monitor (paste inside the existing <directories> section):
<directories check_all="yes" report_changes="yes" realtime="yes">/etc,/usr/bin,/usr/sbin</directories>
<directories check_all="yes" report_changes="yes" realtime="yes">/bin,/sbin,/boot</directories>
<directories check_all="yes" report_changes="yes" realtime="yes">/var/www/html</directories>     <!-- Web content -->
<directories check_all="yes" report_changes="yes" realtime="yes">/root/snap/</directories>         <!-- Custom apps -->
<directories check_all="yes" report_changes="yes" realtime="yes">/root/update.txt</directories>    <!-- Specific file -->
<directories check_all="yes" report_changes="yes" realtime="yes">/etc/</directories>
Save the file and restart the agent to apply changes:
sudo systemctl restart wazuh-agentFIM alerts will now appear on the Wazuh Dashboard whenever a monitored file is created, modified, or deleted.
Verify FIM Alerts on the Manager
You can tail the live alerts log directly on the Wazuh Manager to confirm events are being received:
sudo tail -f /var/ossec/logs/alerts/alerts.jsonStep 8 — Monitor Linux Resource Usage with Wazuh
Beyond security events, Wazuh can monitor system performance — CPU, memory, disk, and load average — and trigger alerts when thresholds are exceeded. This requires configuration on both the agent and the manager.
Official Reference: Wazuh Blog — Monitoring Linux Resource Usage
Part A — Configure the Agent
Edit the Wazuh agent config file:
sudo nano /var/ossec/etc/ossec.confAdd the following <localfile> blocks inside the <ossec_config> block:
<!-- CPU, memory, disk metric -->
<localfile>
   <log_format>full_command</log_format>
   <command>echo $(top -bn1 | grep Cpu | awk '{print $2+$4+$6+$12+$14+$16}' ; free -m | awk 'NR==2{printf "%.2f\t\t\n", $3*100/$2 }' ; df -h | awk '$NF=="/"{print $5}'|sed 's/%//g')</command>
   <alias>general_health_metrics</alias>
   <out_format>$(timestamp) $(hostname) general_health_check: $(log)</out_format>
   <frequency>30</frequency> <!-- Default 30s, change as needed -->
</localfile>

<!-- Load average metrics -->
<localfile>
   <log_format>full_command</log_format>
   <command>uptime | grep load | awk '{print $(NF-2),$(NF-1),$NF}' | sed 's/\,\([0-9]\{1,2\}\)/.\1/g'</command>
   <alias>load_average_metrics</alias>
   <out_format>$(timestamp) $(hostname) load_average_check: $(log)</out_format>
   <frequency>30</frequency>
</localfile>

<!-- Memory metrics -->
<localfile>
   <log_format>full_command</log_format>
   <command>free --bytes| awk 'NR==2{print $3,$7}'</command>
   <alias>memory_metrics</alias>
   <out_format>$(timestamp) $(hostname) memory_check: $(log)</out_format>
   <frequency>30</frequency>
</localfile>

<!-- Disk metrics -->
<localfile>
   <log_format>full_command</log_format>
   <command>df -B1 | awk '$NF=="/"{print $3,$4}'</command>
   <alias>disk_metrics</alias>
   <out_format>$(timestamp) $(hostname) disk_check: $(log)</out_format>
   <frequency>30</frequency>
</localfile>
Restart the agent:
sudo systemctl restart wazuh-agentPart B — Add Decoders on the Wazuh Manager
Create a custom decoder file on the manager to parse the metric logs:
sudo nano /var/ossec/etc/decoders/Linux_Monitoring.xmlPaste the following decoder definitions:
<!-- CPU, memory, disk metric -->
<decoder name="general_health_check">
   <program_name>general_health_check</program_name>
</decoder>

<decoder name="general_health_check1">
  <parent>general_health_check</parent>
  <prematch>ossec: output: 'general_health_metrics':\. </prematch>
  <regex offset="after_prematch">(\S+) (\S+) (\S+)</regex>
  <order>cpu_usage_%, memory_usage_%, disk_usage_%</order>
</decoder>

<!-- Load average metric -->
<decoder name="load_average_check">
   <program_name>load_average_check</program_name>
</decoder>

<decoder name="load_average_check1">
  <parent>load_average_check</parent>
  <prematch>ossec: output: 'load_average_metrics':\. </prematch>
  <regex offset="after_prematch">(\S+), (\S+), (\S+)</regex>
  <order>1min_loadAverage, 5mins_loadAverage, 15mins_loadAverage</order>
</decoder>

<!-- Memory metric -->
<decoder name="memory_check">
   <program_name>memory_check</program_name>
</decoder>

<decoder name="memory_check1">
  <parent>memory_check</parent>
  <prematch>ossec: output: 'memory_metrics':\. </prematch>
  <regex offset="after_prematch">(\S+) (\S+)</regex>
  <order>memory_used_bytes, memory_available_bytes</order>
</decoder>

<!-- Disk metric -->
<decoder name="disk_check">
   <program_name>disk_check</program_name>
</decoder>

<decoder name="disk_check1">
  <parent>disk_check</parent>
  <prematch>ossec: output: 'disk_metrics':\. </prematch>
  <regex offset="after_prematch">(\S+) (\S+)</regex>
  <order>disk_used_bytes, disk_free_bytes</order>
</decoder>
Part C — Add Alert Rules on the Wazuh Manager
Create a custom rules file to trigger alerts when metrics breach thresholds:
sudo nano /var/ossec/etc/rules/linux_resource_rules.xmlPaste the following rule definitions:
<group name="performance_metric,">

  <!-- CPU, Memory and Disk usage (baseline collection) -->
  <rule id="100054" level="3">
    <decoded_as>general_health_check</decoded_as>
    <description>CPU | MEMORY | DISK usage metrics</description>
  </rule>

  <!-- High memory usage alert (>= 80%) -->
  <rule id="100055" level="12">
    <if_sid>100054</if_sid>
    <field name="memory_usage_%">^[8-9]\d|100</field>
    <description>Memory usage is high: $(memory_usage_%)%</description>
    <options>no_full_log</options>
  </rule>

  <!-- High CPU usage alert (>= 80%) -->
  <rule id="100056" level="12">
    <if_sid>100054</if_sid>
    <field name="cpu_usage_%">^[8-9]\d|100</field>
    <description>CPU usage is high: $(cpu_usage_%)%</description>
    <options>no_full_log</options>
  </rule>

  <!-- High disk usage alert (>= 70%) -->
  <rule id="100057" level="12">
    <if_sid>100054</if_sid>
    <field name="disk_usage_%">^[7-9]\d|100</field>
    <description>Disk space is running low: $(disk_usage_%)%</description>
    <options>no_full_log</options>
  </rule>

  <!-- Load average check -->
  <rule id="100058" level="3">
    <decoded_as>load_average_check</decoded_as>
    <description>Load average metrics</description>
  </rule>

  <!-- Memory metrics collection -->
  <rule id="100059" level="3">
    <decoded_as>memory_check</decoded_as>
    <description>Memory metrics</description>
  </rule>

  <!-- Disk metrics collection -->
  <rule id="100060" level="3">
    <decoded_as>disk_check</decoded_as>
    <description>Disk metrics</description>
  </rule>

</group>
Restart the Wazuh Manager to apply all decoder and rule changes:
sudo systemctl restart wazuh-managerWithin 30 seconds, you should start seeing CPU, memory, and disk metrics flowing into your Wazuh Dashboard under the Security Events module.
Wazuh SIEM Is Now Live
Here’s a summary of what you’ve accomplished:
| Step | What You Did | Status |
|---|---|---|
| 1 | Provisioned Ubuntu 22.04 VM in VMware | ✅ Done |
| 2 | Installed base system dependencies | ✅ Done |
| 3 | Deployed Wazuh All-in-One stack | ✅ Done |
| 4 | Accessed Wazuh Dashboard via browser | ✅ Done |
| 5 | Changed default admin password securely | ✅ Done |
| 6 | Deployed first Wazuh agent to an endpoint | ✅ Done |
| 7 | Configured real-time File Integrity Monitoring | ✅ Done |
| 8 | Set up Linux resource usage alerting | ✅ Done |
You now have a fully operational open-source SIEM platform running on your own infrastructure — capable of real-time file integrity monitoring, system performance alerting, log aggregation, and agent-based endpoint visibility.
🔜 What’s Next?
Now that the core stack is running, here are some natural next steps:
- Integrate Windows agents for Windows Server / workstation monitoring
- Configure email alerting via SMTP in
ossec.conf - Set up active response rules to auto-block brute-force attackers
- Connect a firewall syslog feed (e.g., MikroTik, pfSense) to Wazuh
- Explore the Wazuh Vulnerability Detection module
If you found this walkthrough useful, drop a comment below or share it with your team. More SIEM and network security guides are on the way at msachowdhury.com/blog.
Md. Samsel Arifin
Senior IT Engineer — Kolpolok Limited
Specializing in network security, SIEM deployments, and infrastructure hardening. Writing practical guides for IT engineers in the field.
Modern SIEM & Network Security Built for Your Organisation
Whether you need a production‑ready SIEM, a secure network architecture, or a full security overhaul — I provide hands‑on consulting tailored to your environment. From design to deployment, get expert support that keeps your organisation safe and audit‑ready.
Leave a Reply